


WordPress does not ship with an infographic maker. There is no button in the editor that turns a spreadsheet into a chart or an image into a clickable diagram. What you do instead is pick a plugin that handles one specific job, and the right plugin depends entirely on the kind of infographic you have in mind.
That is the part most lists skip. A chart plugin will not help you build a clickable floor plan. An image map plugin will not build you a pricing comparison. So this post is organised by job, not by popularity.
Infographics are still one of the most effective ways to present complex data in a simple, visual format. Whether you need to share important statistics, explain a process, or highlight key information, they make your content more engaging and easier to understand. The seven plugins below cover the four jobs that actually come up: charts and graphs, interactive images with hotspots, visual comparison tables, and listicle-style infographics.
Every one of them has a free version.
Quick comparison
| المكون الإضافي | Best for | Active installs | Free version |
|---|---|---|---|
| الكتل النهائية | Infographic-style blocks inside your posts | 50,000+ | Yes, most blocks free |
| مُصور | Charts and graphs from data | 20,000+ | Yes, includes AI chart builder |
| لفت الانتباه | Clickable image maps and hotspots | 20,000+ | Yes, one image only |
| Tableberg | Visual comparison tables in the block editor | 2,000+ | نعم |
| منشئ جداول WP | Drag and drop visual tables | 50,000+ | نعم |
| مخطط م | Simple spreadsheet-driven charts | 4,000+ | Yes, fully free |
| صانع الرسوم البيانية بالذكاء الاصطناعي | AI-generated listicles | 800+ | نعم |
Install counts are from the WordPress.org plugin directory and change over time.
Which one should you install?
- You want to visualise numbers. Start with Visualizer. If you want something lighter with no upsells at all, use M Chart.
- You want people to click parts of an image. Draw Attention if the image is the whole point, such as a floor plan or a map. Ultimate Blocks if you want hotspots on an image inside a normal blog post.
- You want a comparison, pricing, or pros and cons layout. Tableberg if you work in the block editor. WP Table Builder if you prefer a separate drag and drop canvas.
- You want AI to draft the visual for you. Visualizer’s AI chart builder for data. AI Infographic Maker for listicles.
Let’s go through each one.
الكتل النهائية
الكتل النهائية brings a set of specialised blocks that turn ordinary post content into infographic-style presentations. These blocks are more than traditional design elements. They are built to present data-driven content that both informs and holds attention, without you leaving the editor or learning a separate interface.
The plugin includes 25+ blocks. The ones that matter for infographics are:
- Image Hotspots (Pro). Place interactive markers on top of any image, each with its own rich tooltip. Click a marker and the tooltip opens with whatever you put in it. This is the block to use for annotated diagrams, product feature callouts, or a “what’s in this photo” explainer. You can also transform an existing Image block into an Image Hotspots block, so you do not need to rebuild anything, and it supports borders, border radius, captions, links, and duotone filters.
- Progress Bar. Line or circle style, ideal for goals, percentages, and milestones.
- Timeline (Pro). Lay out events in order, either vertically or horizontally, to tell a story or track a project.
- Counter. Animated number counters for statistics and milestones.
- Styled List. Swap bullets for icons and custom styling so individual data points stand out.
- Star Rating. Show ratings and reviews visually.
- Image Slider. Display multiple images or data points in a responsive slider, which works well for before and after comparisons.
Put together, these do not just present data. They turn a piece of content into something a reader actually moves through.

Top features
- 25+ blocks, all inside the native block editor
- Image Hotspots block with rich tooltips, added in version 3.5.8 (Pro)
- Progress Bar, Counter, Star Rating, and Styled List for stat-heavy content
- Timeline block for chronological stories (Pro)
- Image Slider for visual comparisons
- Full control over fonts, colours, and spacing
- Copy and paste styles between blocks
مُصور

مُصور is the most complete option here for turning raw data into charts and tables. You can produce fully customisable visualisations that fit any screen, and it is used by educators, financial advisors, small business owners, and non-profits.
The biggest change since this post first went live is the built-in AI chart builder. You describe the chart you want in plain language and Visualizer builds it, no API key and no setup required. That is in the free version.
Beyond that, you get an Excel-like editor for entering data by hand, giving you full control over the content and structure of your charts without leaving WordPress. The free version covers line, bar, pie, and table charts. Pro adds scatter, area, geo, bubble, radar, polar, candlestick, and timeline types.
The plugin uses the Google Visualization API, DataTables.net, and Chart.js to keep charts responsive across devices. You can customise nearly every detail, add sorting, pagination, multi-column ordering, and search to your HTML tables, and set permissions to control who can view or edit each chart. Automatic data syncing from CSV files, Google Sheets, or external APIs is a Pro feature.

Top features
- AI chart builder that works from a plain text description (free)
- Basic chart types in the free version: table, line, pie, and bar
- Advanced chart types in Pro: scatter, area, geo, bubble, radar, polar, candlestick, timeline
- Excel-like manual data editor
- Fully responsive on all devices
- Permission controls for viewing and editing charts
- Pagination, search, multi-column sorting, and text filtering
- Works in the block editor and other page builders
لفت الانتباه

لفت الانتباه makes it simple to create interactive image maps, with a focus on highlighting specific areas of any image. You add clickable hotspots that reveal more information on hover or click, turning a static visual into something people explore.
You draw custom shapes over the parts of the image you want to highlight, whether that is a floor plan, a set of product features, or a clickable infographic. When someone clicks or hovers, you can reveal text, images, video, or link them somewhere else entirely. The plugin includes over 20 preset colour schemes, and you can control whether the extra information appears beside the image, in a lightbox, or in a tooltip.
One thing worth knowing before you install: the free version lets you create واحد interactive image. Hotspots on that image are unlimited, but if you need a second image you need Pro, which is $99 for a single site or $199 for unlimited sites. For a lot of use cases, one image is genuinely enough. Just go in knowing it.
The plugin is actively maintained and now provides a block, so you are not stuck with shortcodes.

Top features
- Unlimited clickable hotspots on your image
- Draw custom shapes directly over the image
- Show more information or send users to a URL
- Text, images, video, and shortcodes supported inside hotspots
- Over 20 preset colour schemes
- Layout options including beside the image, lightbox, or tooltip
- Block editor support
- Free version limited to one interactive image
Tableberg

Tableberg is a block-based table builder, and tables are an underrated infographic format. A well-built comparison table communicates faster than a chart when the thing you are comparing is features rather than numbers.
Tableberg’s defining feature is its sub-blocks. Each cell can hold images, lists, buttons, ribbons, icons, or star ratings, so a table stops looking like a spreadsheet and starts looking like a designed comparison. You can merge cells, adjust dimensions, and duplicate or move rows and columns. Sticky rows and columns keep your header and first column visible while readers scroll a wide table.
Built-in sorting and search let visitors filter down to what they need, and the responsive settings handle how the table collapses on smaller screens. Combined with control over global font colour and size, padding, and spacing, it works well for pricing tables, feature comparisons, and pros and cons layouts.
You can see it working on the عرض جداول المقارنة, عرض جداول التسعير، و pros and cons demo.

Top features
- Responsive design for all screen sizes
- Text, image, list, button, ribbon, icon, and star rating sub-blocks
- Sorting and search
- Merge cells and adjust dimensions
- صفوف وأعمدة مثبتة
- Duplicate or move rows and columns
- Runs natively in the block editor
منشئ جداول WP
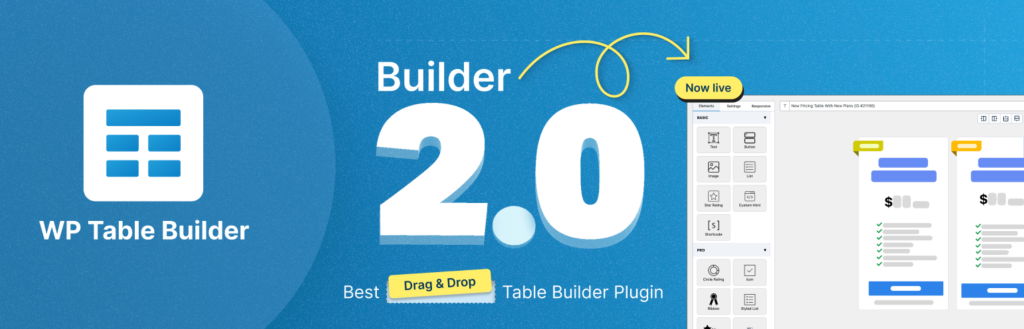
منشئ جداول WP takes the same idea in a different direction. Instead of building inside the block editor, you get a separate drag and drop canvas, which some people find faster for laying out a table from scratch.
It offers seven elements for presenting data visually: text, images, buttons, lists, star ratings, custom HTML, and shortcodes. That mix is what lets a table function as an infographic rather than a data dump, and it suits product comparisons, showcases, and summaries. Sorting, search, and pagination are all there so readers can interact with the data.
You can also merge cells, adjust row heights, and start from pre-built templates for a quicker setup. Responsive design keeps things clean across devices.

Top features
- Drag and drop interface
- Cells that hold text, images, buttons, and star ratings
- Merge cells and adjust column and row dimensions
- Custom fonts, colours, and styling
- Sorting, search, and pagination
- قوالب جاهزة
- الجداول المستجيبة
مخطط م

مخطط م simplifies managing data and creating charts from the WordPress dashboard. Line, bar, pie, or column, it gives you what you need to visualise data using Chart.js or Highcharts.
It provides a spreadsheet-like interface for quick data management, either by typing values in or importing a CSV. You can export back to CSV too, which is unusual among free chart plugins. The real-time preview shows the effect of each change as you make it.
Customisation is straightforward. You can adjust chart height, add legends, and label axes with relevant units like distance, currency, sales, referrers, or web traffic, so the chart matches both your data and your site.
One note: since version 1.7, Highcharts is no longer bundled with the plugin. If you want the Highcharts features you need to install the separate M Chart Highcharts Library plugin first. Chart.js works out of the box.
M Chart is genuinely free with no paid tier, which makes it a good pick if you dislike upgrade prompts.

Top features
- Charts via Chart.js or Highcharts
- Chart types including spline, doughnut, stacked column, and radar area
- Spreadsheet-like interface
- Manual entry or CSV upload
- Export chart data to CSV
- Real-time preview
- Adjustable height, legends, and axis labels
- Shortcode and block embedding
- Completely free
صانع الرسوم البيانية بالذكاء الاصطناعي

صانع الرسوم البيانية بالذكاء الاصطناعي (also known as iList) creates responsive infographics and listicles using OpenAI, directly from your WordPress backend. It is the only plugin on this list that generates the content as well as the layout.
The free version includes 20+ responsive templates for text lists, image lists, and data-driven infographics, with Bar, Pie, Line, Polar Area, Radar, and Doughnut chart types. It also supports interactive extras like upvotes, sharing, and embedding, so other sites can republish your infographic with a link back. Pro takes it to 80+ templates, multi-page listicles with unique URLs, and ad space.
Be aware that this is a much smaller plugin than the others here, with a few hundred active installs and less frequent updates. Test it on a staging site first. It is on this list because the WordPress directory has very few plugins in the infographic category at all, and this is the only one built specifically around AI-generated listicles.

Top features
- AI-generated content for infographics and listicles
- Bar, Pie, Line, Polar Area, Radar, and Doughnut charts
- 20+ templates free, 80+ in Pro
- Customisable fonts, colours, layouts, and design
- Multi-page listicles with unique URLs and ad space (Pro)
- Sharing, upvoting, and embedding
- Shortcode embedding
Frequently asked questions
Does WordPress have a built-in infographic maker?
No. WordPress has no native infographic tool. The block editor gives you images, tables, and basic layout, but anything interactive or data-driven needs a plugin. The plugins above fill that gap.
What is the best free WordPress infographic plugin?
It depends on the format. For charts, Visualizer’s free version now includes an AI chart builder, which is the most capable free option. For blocks you drop straight into a post, Ultimate Blocks. For a fully free chart plugin with no paid tier at all, M Chart.
Can I make an infographic without design skills?
Yes. Every plugin here uses templates or a visual editor, so you are not writing CSS. AI Infographic Maker and Visualizer’s AI builder go a step further and draft the visual for you from a text prompt.
Should I use an image or an HTML infographic?
HTML infographics, which is what all these plugins produce, stay readable on mobile, work with screen readers, and let search engines read the text inside them. A flat image does none of that. The tradeoff is that an image is easier for other people to share, so some publishers do both.
How do I add hotspots to an image in WordPress?
Two options. Draw Attention if the image is the centrepiece of the page, since it is built for image maps and lets you draw custom shapes. Ultimate Blocks Pro if you want hotspots on an image inside a regular post, using the Image Hotspots block, which you can also convert an existing Image block into.
خاتمة
Infographics turn complex data into something people actually read. The plugins here cover the four formats that matter: charts, interactive images, visual tables, and listicles.
If you are not sure where to start, install Visualizer for charts and Ultimate Blocks for everything you build inside a post. Both are free, both take minutes to set up, and between them they cover most of what people mean when they say “infographic.”
