
People use charts when plain numbers aren’t enough. They are one of the most effective ways to present complex information in a simple, digestible visual format. Be it for reporting, presentations, or everyday content, charts turn static information into something visual and easier to read.
Out of all the chart types available, pie charts remain one of the most commonly used. They’re straightforward, familiar, and work especially well when you need to show how something is divided. From market share comparisons to budget breakdowns, pie charts quickly communicate parts of a whole without needing much explanation.
To help you create those charts directly inside WordPress, we’ve picked a few solid plugins that make the process smooth, flexible, and beginner-friendly. Let’s start.
مُصور
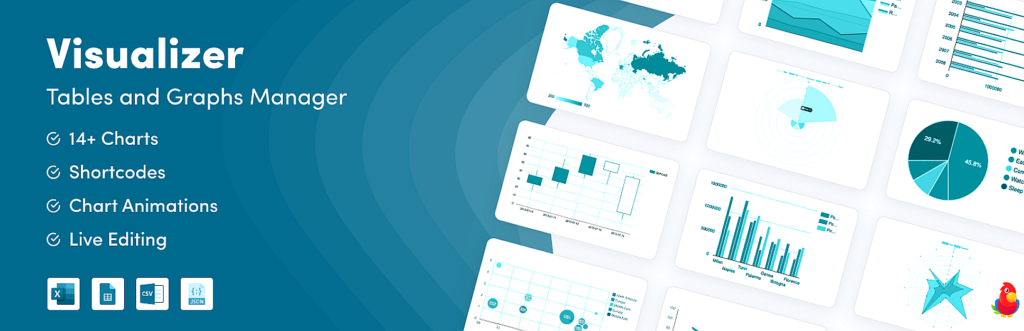
If you’re serious about adding clean, interactive charts to your WordPress site, مُصور is one of the most well-rounded tools you can pick. It supports a variety of chart types, comes with a user-friendly interface, and works directly inside the WordPress dashboard without requiring any coding knowledge.
The plugin provides a wide range of chart types, including line, bar, area, geo, combo, polar, radar, and more. You can enter data or import it from external sources like CSV files or Google Sheets manually. Tables come with options for sorting, search, and pagination, while every chart and table can be customized to match your site’s design through color settings, font adjustments, and layout tweaks. All visual elements are produced using HTML5/SVG to ensure sharpness and mobile responsiveness.
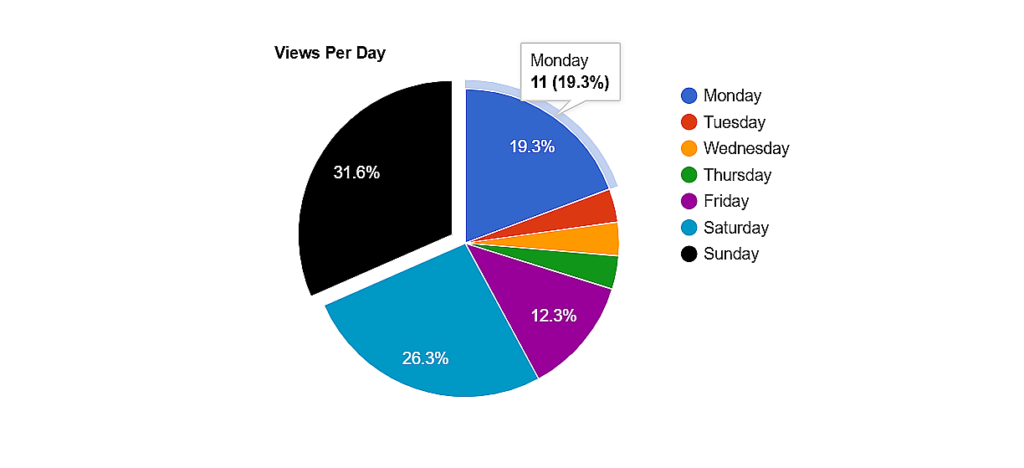
Its pie chart feature lets you visualize proportions with clean, colorful slices. You can customize slice colors, labels, legends, and even enable animations or tooltips for better interaction. So if you’re comparing parts of a whole or summarizing stats, Visualizer offers pie charts that adapt to your content and fit naturally into any layout.
أهم المميزات
- محرر شبيه بـ Excel.
- Built with Google Visualization and ChartJS.
- Supports 15+ chart types, including pie, line, bar, and table.
- Manual data entry or import from CSV and Google Sheets.
- Fully responsive HTML5/SVG charts.
- Customizable colors, labels, legends, and tooltips.
- Control the permission of the charts.
- Works with Gutenberg, Classic, and page builders.
سعر
Visualizer has both free and Pro versions, with the Pro version starting at $99/year. The good news is that the pie chart feature comes freely with the plugin.
Graphinha

جرافينا makes it easier to build charts in WordPress without relying on complicated setups or external tools. It runs on the ApexCharts framework and adds ready-to-use chart blocks directly into the Gutenberg editor.
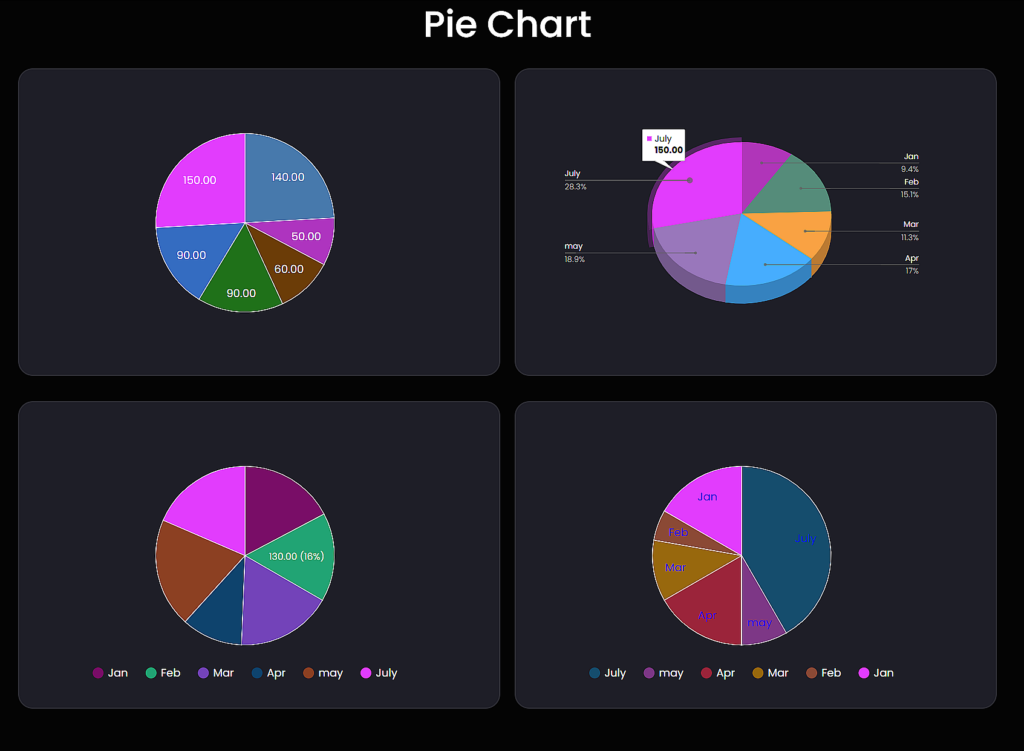
You’ll find a solid variety of chart types, including line, column, radar, area, scatter, donut, pie, and more. Each chart is customizable with options for colors, background styles, axis formatting, and number display. You can bring in data manually or pull it live from sources like Google Sheets, CSV files, APIs, or even SQL databases. The charts are responsive, work across all modern browsers, and include animation support for a more polished experience.
If you’re looking to add a pie chart, the process is simple. Choose your layout, adjust the appearance, and connect it to your preferred data source. Pie charts in Graphina work well for visualizing percentages or segments and can be adapted for both static and real-time content.
أهم المميزات
- Gutenberg chart blocks for all types.
- Connect data from APIs, SQL, CSV, or Google Sheets.
- Style customization for legends, colors, background, and axes.
- Responsive layout and animated transitions.
- Role-based visibility and chart access control.
سعر
Graphina includes both free and Pro versions, with the Pro version starting at $49 per year.
Chart Block

Chart Block is a simple solution for adding clean, straightforward charts to your WordPress site. It integrates directly with the Gutenberg editor and includes everything you need to create visual data blocks without relying on external libraries or complicated data sources.
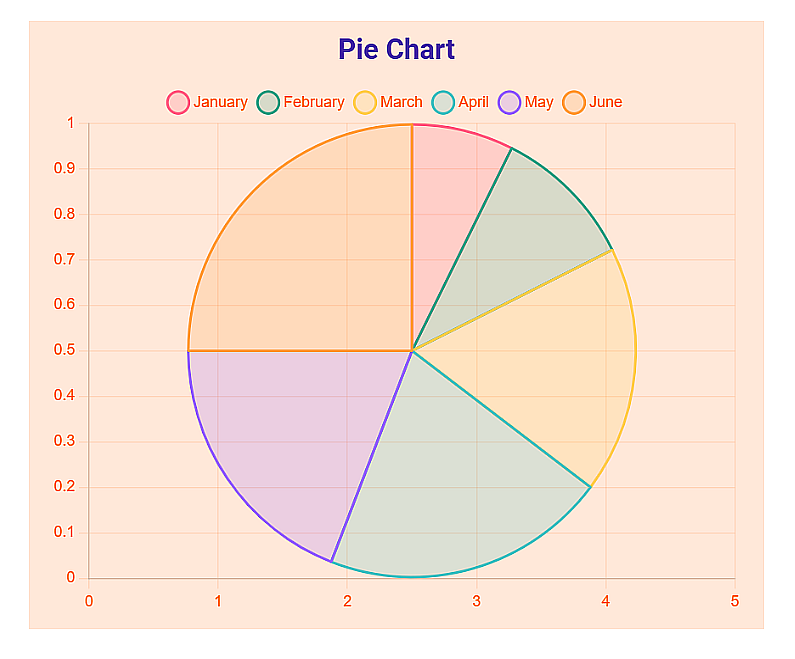
The plugin supports several chart types, including line, bar, radar, doughnut, polar area, and pie. You can adjust text, background, and grid line colors, set chart dimensions, and enter data manually for each label and dataset. The interface is easy to follow, and all configuration options are available in the block sidebar. You can also control point size, border width, font size, and enable or disable chart elements like axes and titles.
Chart Block lets you create pie charts by entering values manually and assigning custom labels for each slice. You can adjust the chart’s size, change background and text colors, and fine-tune display elements like titles, subtitles, and grid lines. It works best for simple data displays where you want full control without relying on external data sources.
أهم المميزات
- Supports multiple chart types, including pie, line, and radar.
- Manual data entry with full label and style controls.
- Customizable width, height, background, and text color.
- Option to toggle scales, grid lines, and chart titles.
- Seamless integration with the Gutenberg block editor.
سعر
Chart Block is completely free.
خاتمة
Pie charts may seem simple, but when used well, they can make your content far more understandable and effective. The plugins in this list take that simplicity and pair it with the right level of control. Some focus on speed and ease of use, while others offer advanced styling and support for dynamic data. Whether you need something minimal or more feature-rich, each tool gives you a practical way to turn raw numbers into something clear and visual.

