
An interactive table is one that allows users to interact with the data dynamically, unlike a static table, which only displays information and does not respond to user actions. These tables respond to user actions like sorting, filtering, searching, or clicking to make analyzing and navigating large datasets easier.
The real power of interactive tables lies in their flexibility to adapt to user preferences and needs. Users aren’t stuck with a fixed presentation of data and can instead personalize how they view and understand information.
Our article explains how to make tables interactive in WordPress by adding features that enhance usability and navigation. It covers key indicators of interactivity and practical steps to create a dynamic table. Let’s dive in.
Difference between an interactive and a Static table
|
Feature |
Interactive Table |
Static Table |
|---|---|---|
|
Sorting |
Users can click column headers to sort data. |
Data is displayed in a fixed order. |
|
Search & Filtering |
A search bar or filters allow users to find specific data. |
Users must manually scan through all rows. |
|
Pagination |
Data is divided into pages for easy navigation. |
All data is displayed at once. |
|
Editable Fields |
Users can modify values directly in the table. |
Data is static and cannot be edited from the frontend. |
|
Hover Effects |
Row or cell background changes when hovered. |
No visual feedback when hovering. |
|
Buttons & Links |
Clickable elements trigger actions like opening pages or downloading files. |
Only text and images are displayed without interaction. |
|
Responsive Design |
The table adjusts for different screen sizes. |
The layout remains fixed and may not be mobile-friendly. |
|
Live Data Updates |
Content updates automatically without a page refresh. |
Data remains unchanged until manually updated. |
Make Your Tables Interactive in WordPress
There are several ways to create interactive tables in WordPress, perhaps using a block, custom code, or a dedicated plugin. For our guide, we’ll use Tableberg, a block-based table plugin that makes it easy to add sorting, search, and responsive features without coding.
Step 1: Install the Tableberg Plugin
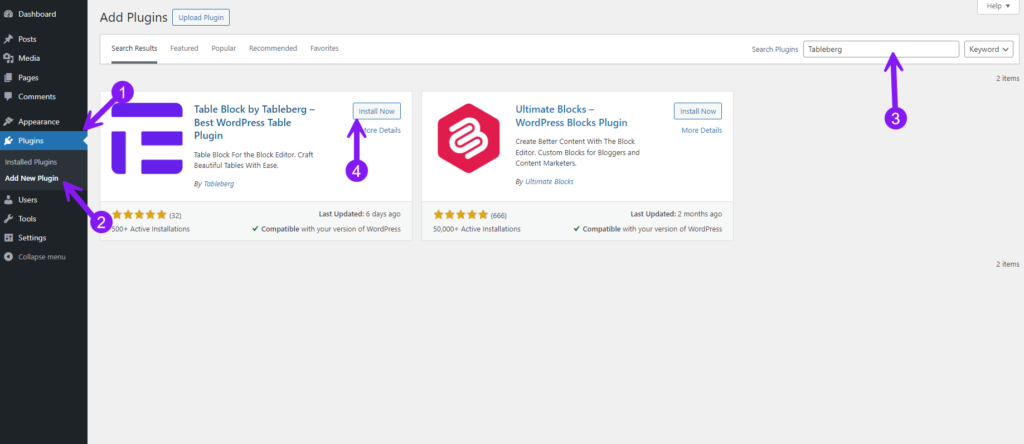
To get started, you’ll first need to install Tableberg from the WordPress repository.
Go to your WordPress dashboard, navigate to Plugins > Add New, and search for Tableberg in the search bar. Click Install Now and then Activate the plugin.
Step 2: Add a Table Using Tableberg
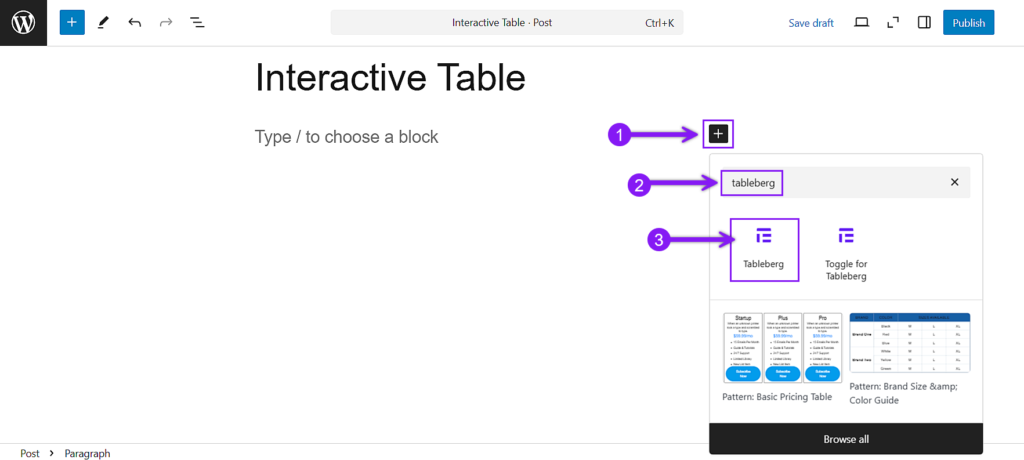
With Tableberg installed, you can now insert a new table into your post or page. Open the WordPress editor and click the + (Add Block) button. Search for Tableberg, then select it to add a blank table. Once inserted, adjust the number of rows and columns as needed and click inside any cell to start entering data.
If you’ve already been using the default WordPress table block, you can easily convert it to the more advanced Tableberg block. Simply click on your existing table block, and in the toolbar, select the block type switcher. Choose ‘Tableberg’ from the options, and your table will instantly be converted.
Step 3: Enable Interactive Features
Tableberg offers numerous features to make your tables engaging and interactive:
Add Sorting Options
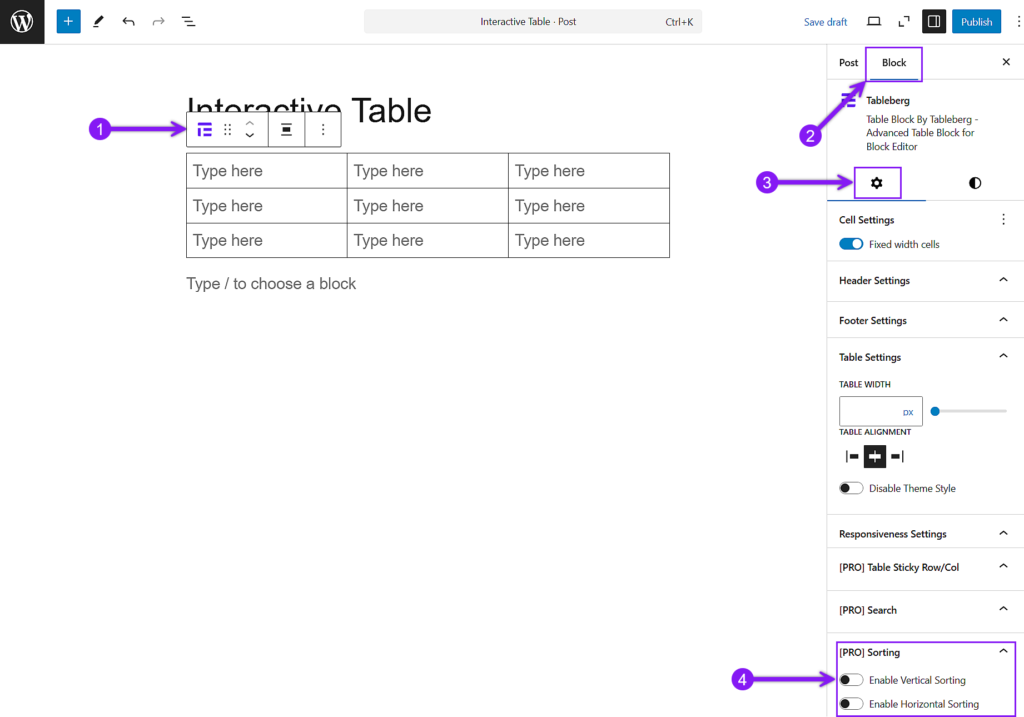
Enable users to sort your table by clicking on column headers. In the block settings panel, toggle the sorting option to allow dynamic ordering of table data. To enable this, select the Tableberg block, then open the settings panel on the right side of the editor. Locate the Sorting option and toggle it on.
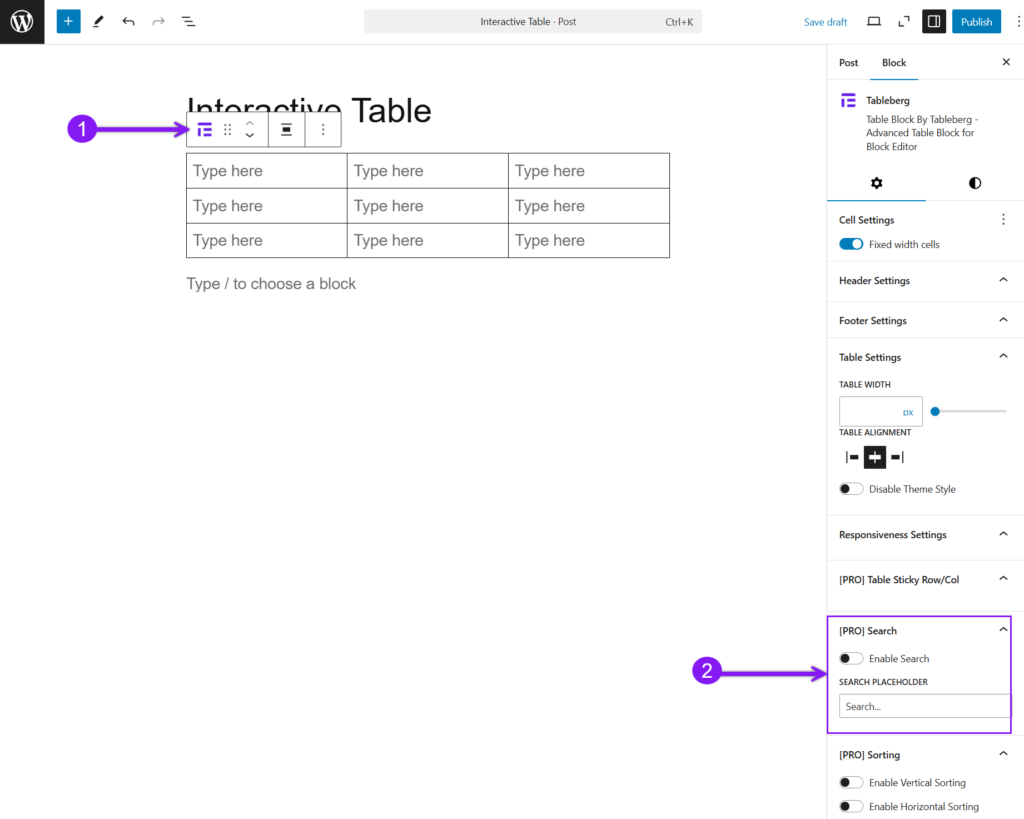
Add a Search Bar
Include a search bar at the top of your table to let users filter data instantly. This is useful for tables with multiple rows, as it helps visitors find relevant information quickly. Similar to the sorting feature, select the table, navigate to the settings panel, look for the Enable Search option, toggle it on, and a search bar will appear above the table.
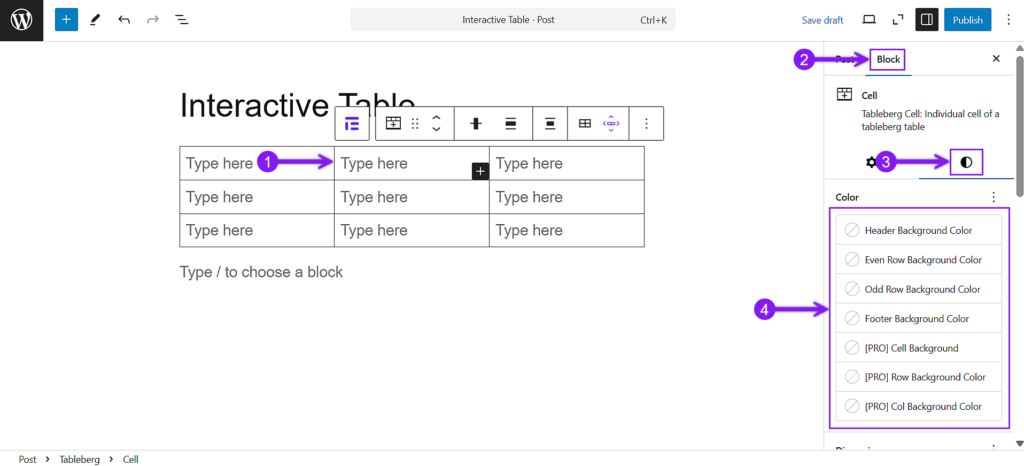
Customize Row and Column Colors
Use Tableberg’s built-in styling options to change row and column colors. Alternating colors for odd and even rows improves readability, making large tables easier to navigate. To apply alternating row colors, select any cell (click at any corner of the cell), go to the table Settings panel, move to the Styles settings, locate the Color option, and choose different colors for odd and even rows.
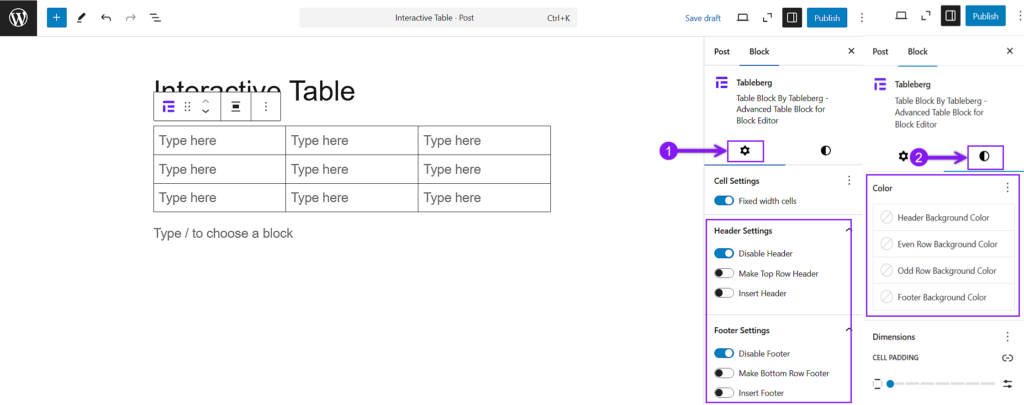
Adjust Header and Footer Settings
Customize the table header and footer to highlight important information. To define headers and footers, select any cell, click on the tableberg icon on the toolbar, open the Block settings, enable Header and Footer the way you like, and change their color from the Styles settings.
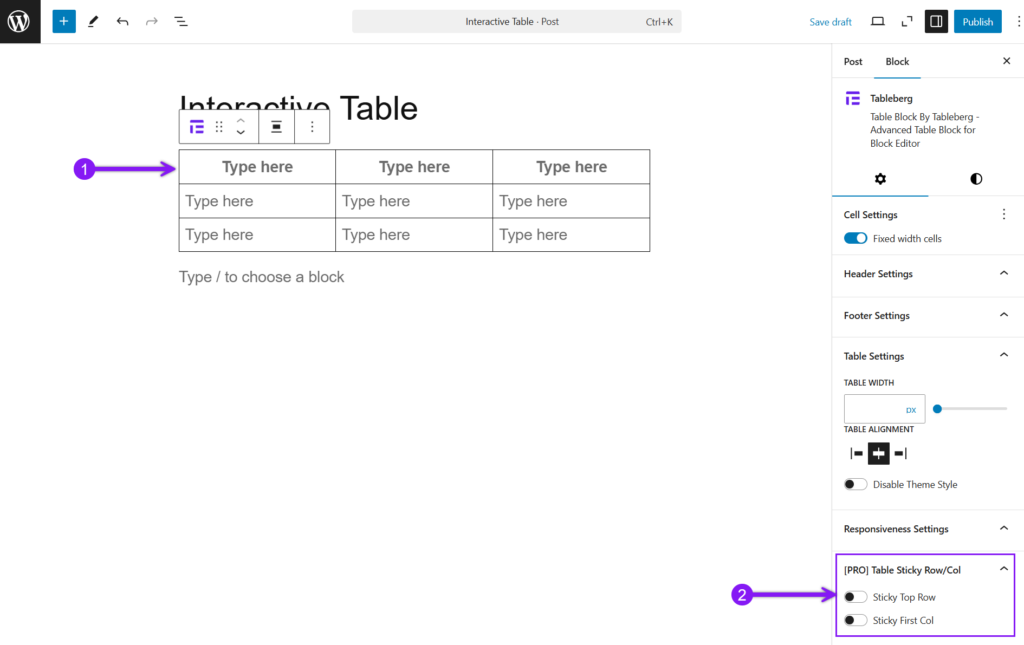
If you want the header to stay visible while scrolling, click your header, scroll down to the Table Sticky row/column feature, and toggle the feature you want to enable.
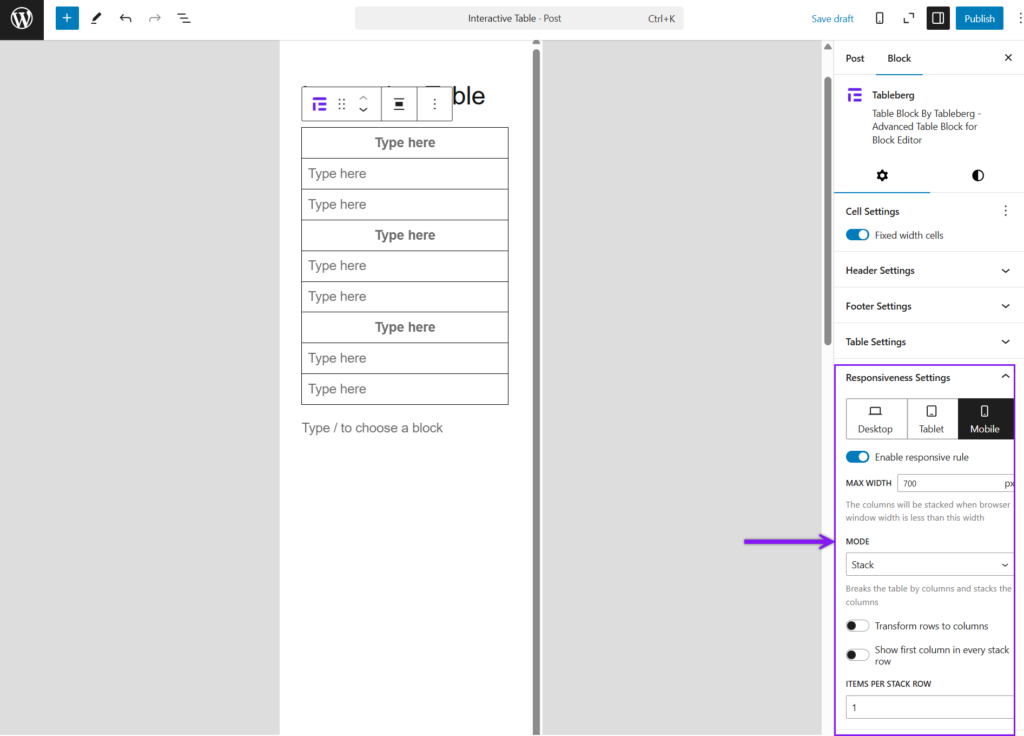
Ensure Table Responsiveness
For mobile-friendly tables, select your table, move to the block settings, and enable Responsive Table from the dropdown. This adjusts columns automatically based on screen size to ensure the table displays properly on all devices. You can choose Scroll or Stack mode to present your table. In Scroll Mode, users can swipe horizontally. In Stack Mode, rows become vertical sections. You can also enable Transform Rows to Columns to restructure data and Show First Column in Every Stack Row to keep key information visible in each section.
Key Indicators of an Interactive Table
|
1. Sorting Users can click on column headers to sort data in ascending or descending order. |
2. Searching A search bar above or below the table where users can type keywords to filter rows.
|
3. Filtering Dropdowns, checkboxes, or sliders let users narrow down data based on specific criteria.
|
|
4. Pagination Large datasets are split into multiple pages for easier navigation.
|
5. Responsive Design The table adapts to different screen sizes, i.e., mobile, tablet, and desktop. |
6. Hover Effects Rows or cells that change color or style when the cursor hovers over them. |
|
7. Expandable Rows Rows that expand to reveal additional details when clicked.
|
8. Editable Cells Users can modify data directly within the table (common in admin dashboards). |
9. Export Options Users can download the table data in formats like CSV, Excel, or PDF.
|
When Should You Use an Interactive Table?
Interactive tables are not always necessary, but they are essential when dealing with large, complex, or frequently updated data. Here’s when using an interactive table makes sense:
1. When Your Table Contains Large Data Sets
If your table has dozens or hundreds of rows, users will struggle to find what they need. Sorting, Search, and Pagination make large datasets easier to navigate.
2. When Users Need to Compare Data
Interactive elements like sorting and filtering help users compare multiple data points. This is useful for pricing tables, product specifications, financial reports, and sports rankings.
3. When Your Data Requires Frequent Updates
If your table contains dynamic information, such as pricing changes, stock market updates, or event schedules, an interactive table makes it easier to manage and display updates without overwhelming visitors.
4. When Your Audience Uses Mobile Devices
Static tables can break on smaller screens. Interactive tables with responsive settings (scroll or stack mode) ensure that data remains accessible across all devices.
5. When You Want to Improve Engagement
Tables that allow user interaction (such as searching, sorting, and filtering) keep visitors engaged longer. This is especially useful for directories, listings, and knowledge bases where users must find specific details quickly.
Conclusion
Imagine a product comparison table where users have to scroll endlessly to find what they need. A static table forces them to go through every entry, while an interactive one lets them arrange by price, refine by brand, or search for specific features. When handling extensive or detailed content, tools like sorting, filtering, and adaptability ensure smooth navigation. Smaller tables with minimal data remain effective without extra functionality. The key is to structure the table in a way that allows users to interact with it effortlessly. With the right approach, you can transform any table into an engaging and practical resource that simplifies exploration, enhances usability, and makes information more intuitive to access.
Also Read:

