
Humans are wired to compare. It is how we navigate uncertainty. We weigh options to avoid regret and seek confirmation that we are choosing wisely. When we reach a decision point, we dissect, contrast, and question. Without a clear way to evaluate differences, our doubt grows. And doubt is the enemy of action.
When users land on your site to compare products, plans, or services, they hunt for proof. Proof that one option crushes the others. Proof that their time and money won’t be wasted. What else do they want? They want ruthless honesty, they want to see flaws laid bare, not hidden, they crave contrasts sharp enough to slice through marketing fluff.
This is why WordPress sites use different types of comparisons depending on what the reader wants to resolve. In the sections ahead, this guide will show you how to build a perfect feature comparison table in WordPress.
- Standard Types of Feature Comparison Tables
- Create a Feature Comparison Table
- Step 1: Install and Activate Tableberg
- Step 2: Insert the Tableberg Block
- Step 3: Add Column Headers for Comparison Options
- Step 4: Enter Feature Names in the First Column
- Step 5: Fill Each Cell with Feature Values or Content
- Step 6: Customize Table Styles
- Step 7: Make the Table Responsive
- Step 8: Enable Sorting and Search Options
- Step 9: Preview and Publish the Table
- Skip the Setup with a Ready-Made Template
Standard Types of Feature Comparison Tables
Comparison tables come in different forms depending on what users want to figure out. Sometimes they care about price. Sometimes it’s missing features. What matters is using the right structure for the right decision.
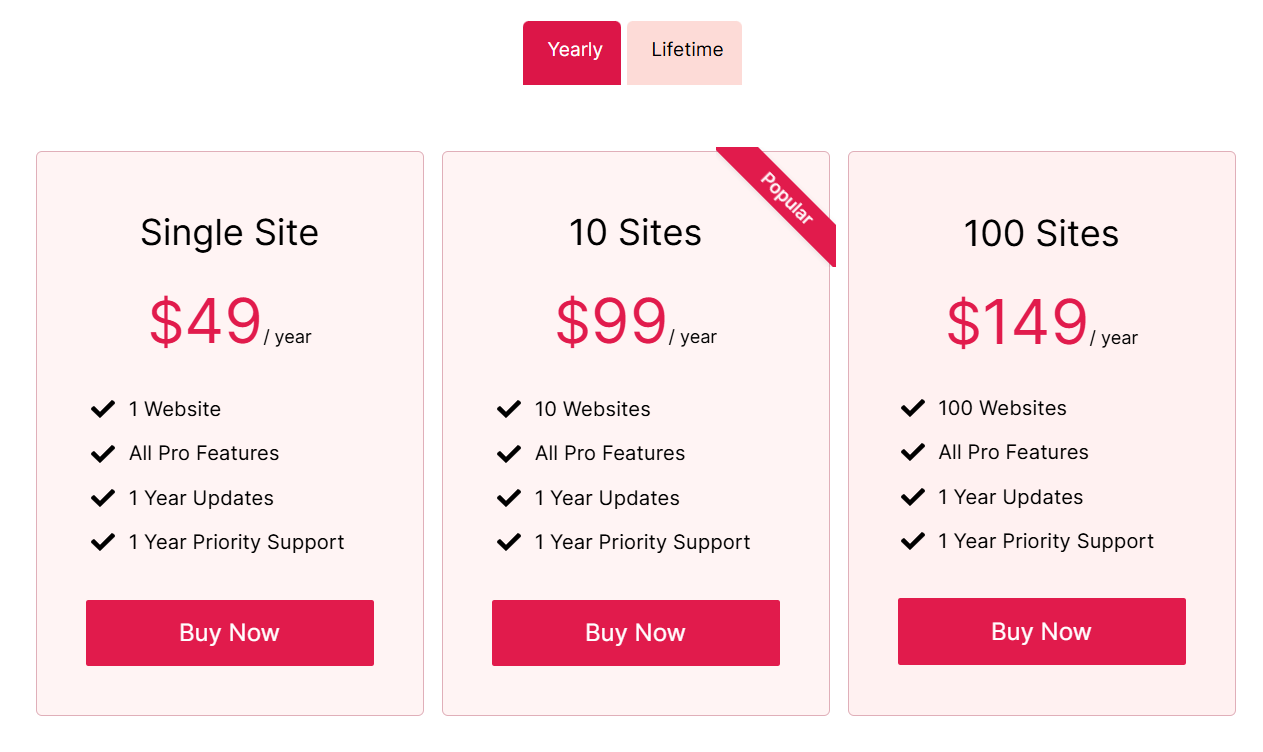
Pricing Comparison Table
This format compares plans side by side. Rows list features. Columns show each tier. Checkmarks or values reveal what’s included. It’s built for buyers deciding what they can get for the price.
Product Specification Table
Great for tech products with measurable specs. Each row defines a specific specification, and the adjacent cell provides the value for that product. Categories like Display, Battery, or Performance are often grouped to make scanning easier.
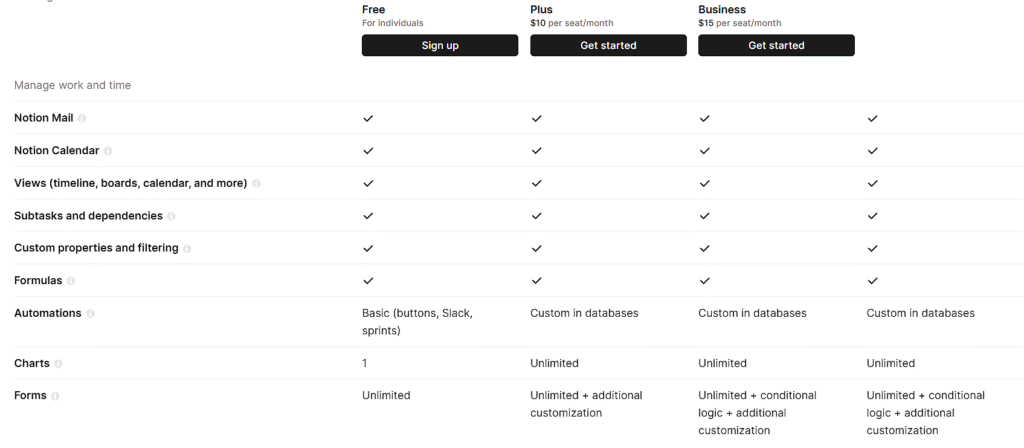
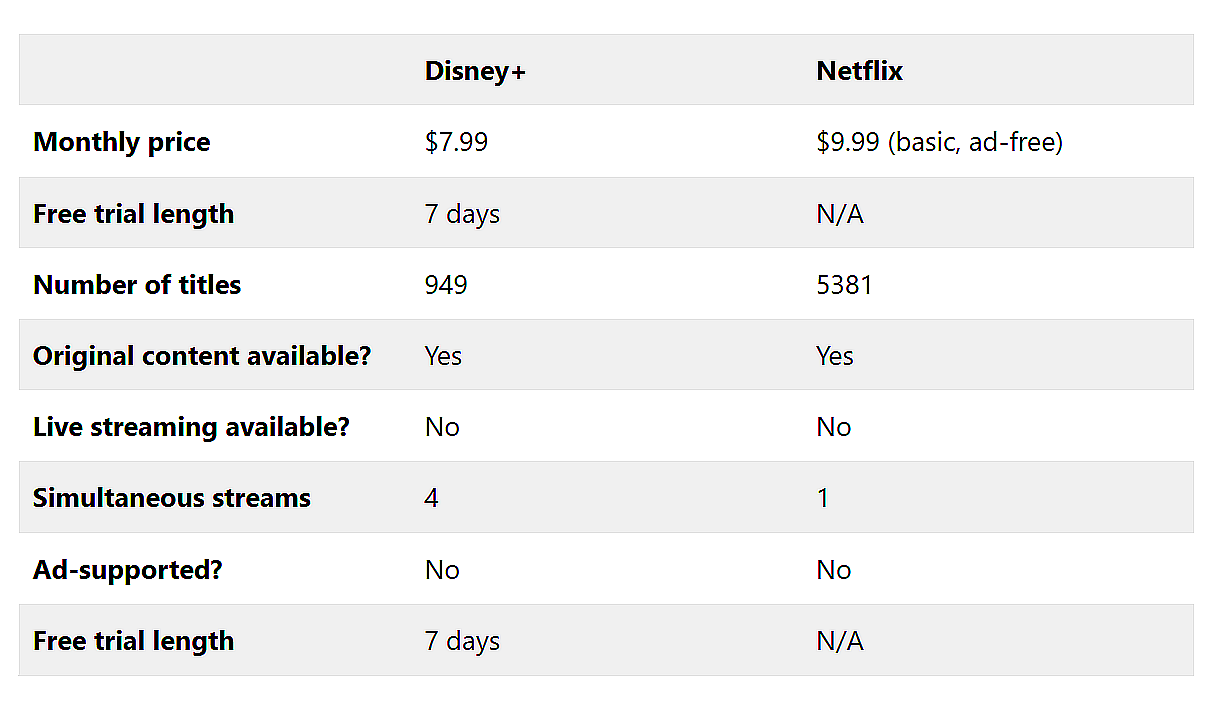
Feature Availability Matrix
Used when users just want to know “Does this have it or not?” Features are listed as rows, and the compared options appear as columns. Cells typically show checkmarks, text indicators, or numeric limitations.
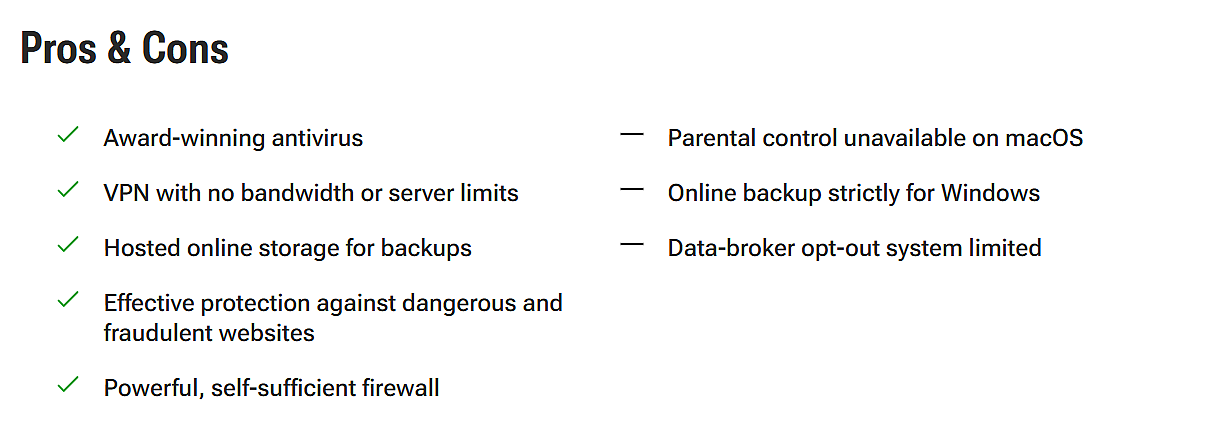
Pros and Cons Table
Not everything can be measured. Sometimes it’s about tradeoffs. This format gives each tool a short list of what it gets right and where it falls short.
One-to-One Comparison Table
Designed for comparing two alternatives directly. Each column represents one option. Rows describe specific attributes like support, pricing, or integration. This structure highlights how two solutions differ in a controlled layout.
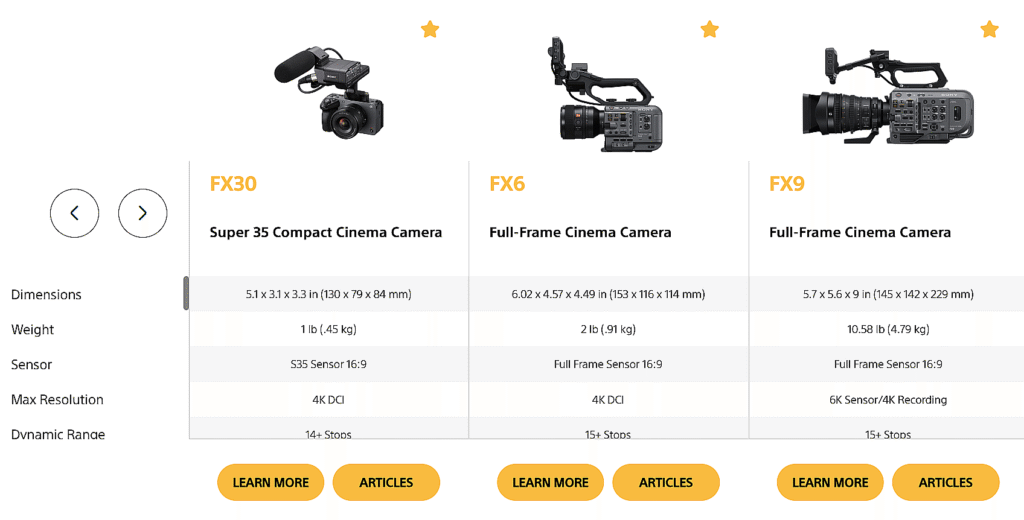
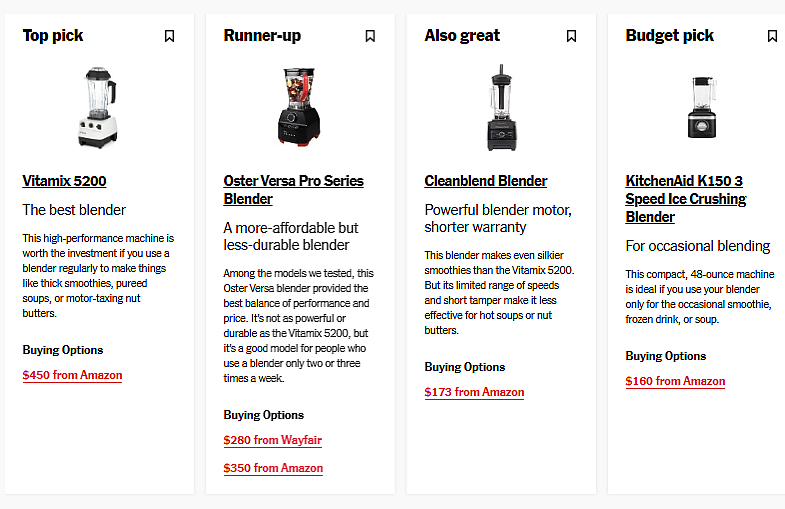
Multi-Product Comparison Table
Meant for broad evaluations where readers are exploring several products at once. Each product appears as a row. Columns are used for key features, use cases, or rankings. This layout supports quick scanning and comparison across multiple criteria.
Feature Comparison Table
Basic |
Standard |
Advanced |
|
|---|---|---|---|
Product |
 |
 Most Popular |
 |
Display |
13.3″ (1920×1080) |
14″ (2560×1600) |
15.6″ (3840×2160) |
Processor |
Intel Core i5 |
Intel Core i7 |
Intel Core i9 |
Storage |
256GB SSD |
512GB SSD |
1TB SSD |
Battery Life |
8 hours |
12 hours |
15 hours |
Weight |
2.8 lbs |
3.2 lbs |
4.0 lbs |
Price |
$799 |
$1,199 |
$1,599 |
User Review |
|||
Buy |
Create a Feature Comparison Table
The default Table block in WordPress lacks the flexibility needed for serious feature comparisons. If you need multiple content types in one cell, want better control over design, or plan to compare more than two products cleanly, you need a block-based table plugin. Tableberg is built exactly for that purpose.
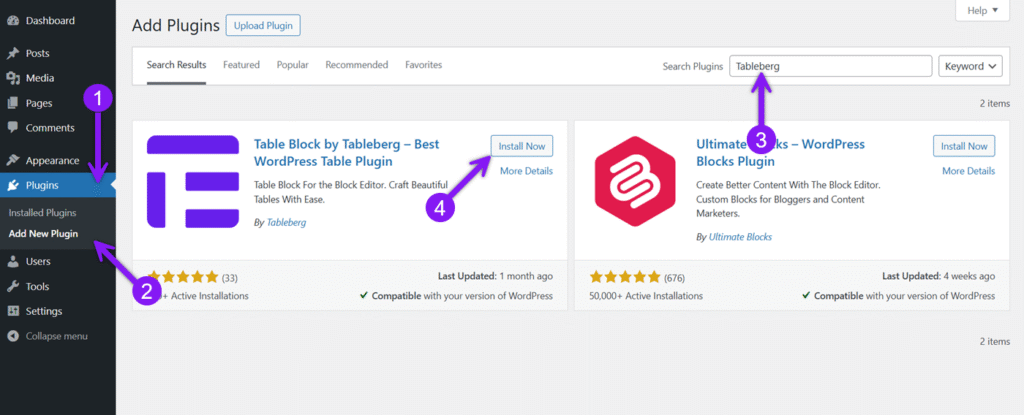
Step 1: Install and Activate Tableberg
Go to Plugins → Add New in your WordPress dashboard. Search for “Tableberg,” then click Install and Activate. The block will now be available in your editor.
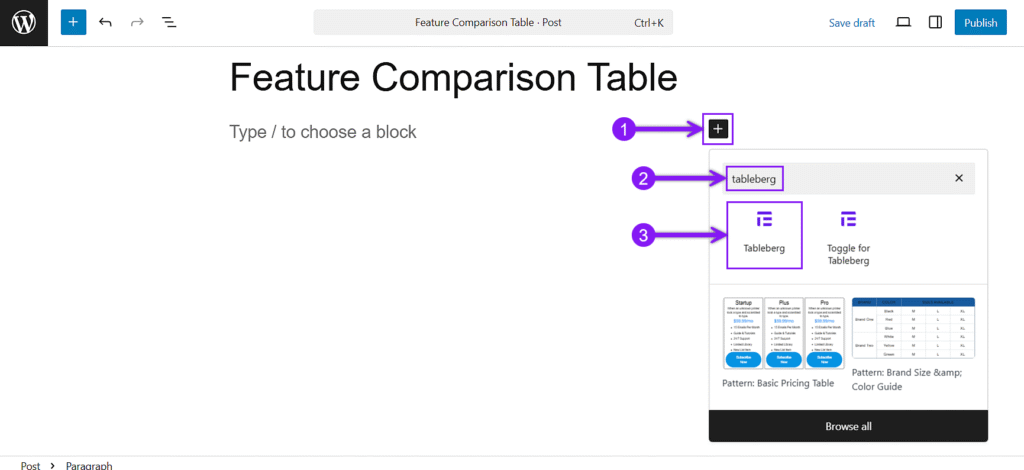
Step 2: Insert the Tableberg Block
Open the post or page where you want to add your comparison table. Click the block inserter “+” icon to add a block, then search for “Tableberg.” Click it to insert the block. A setup box will appear where you can select the number of rows and columns. Use this to create the basic table structure.
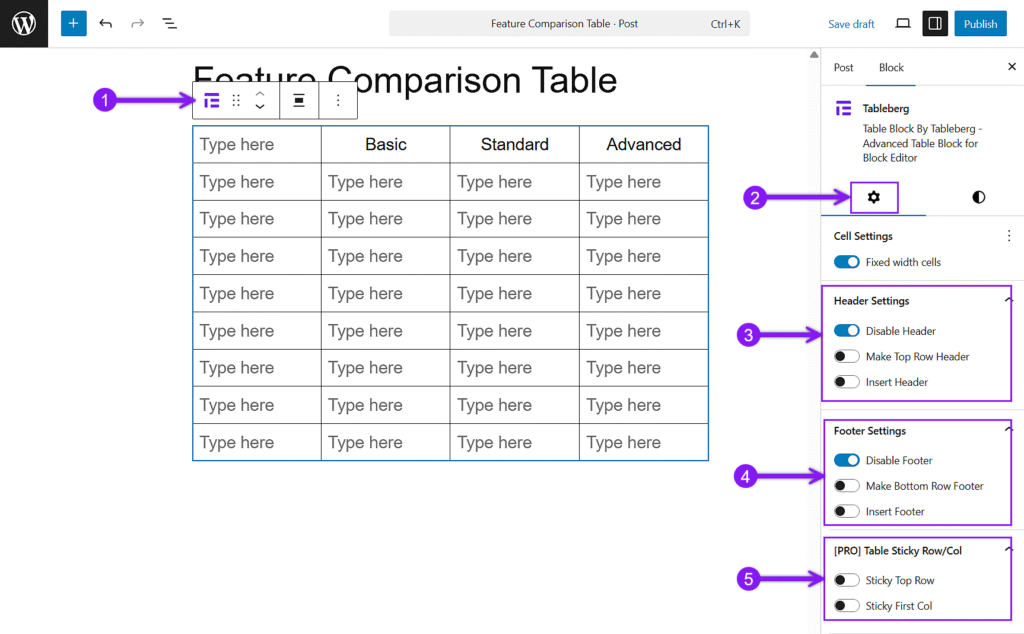
Step 3: Add Column Headers for Comparison Options
Click the table to open the block settings sidebar, then go to the General tab. Under the Header section, choose whether to insert a new header row or to use the top row as the header. After that, add the items you’re comparing. You can enable a footer the same way if needed. You can also use the sticky header (Pro) option in the block settings to keep the top row visible while scrolling.
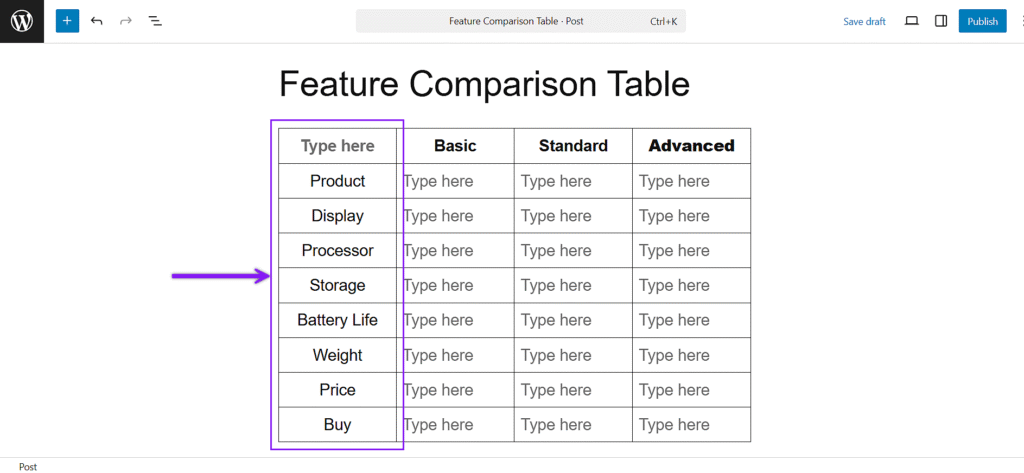
Step 4: Enter Feature Names in the First Column
In a feature comparison table, the first column is commonly used to list the features you’re evaluating. Click into each cell down that column and enter one feature per row. You can utilize bold or italic formatting to highlight key terms, or apply text color from the block setting for visual contrast.
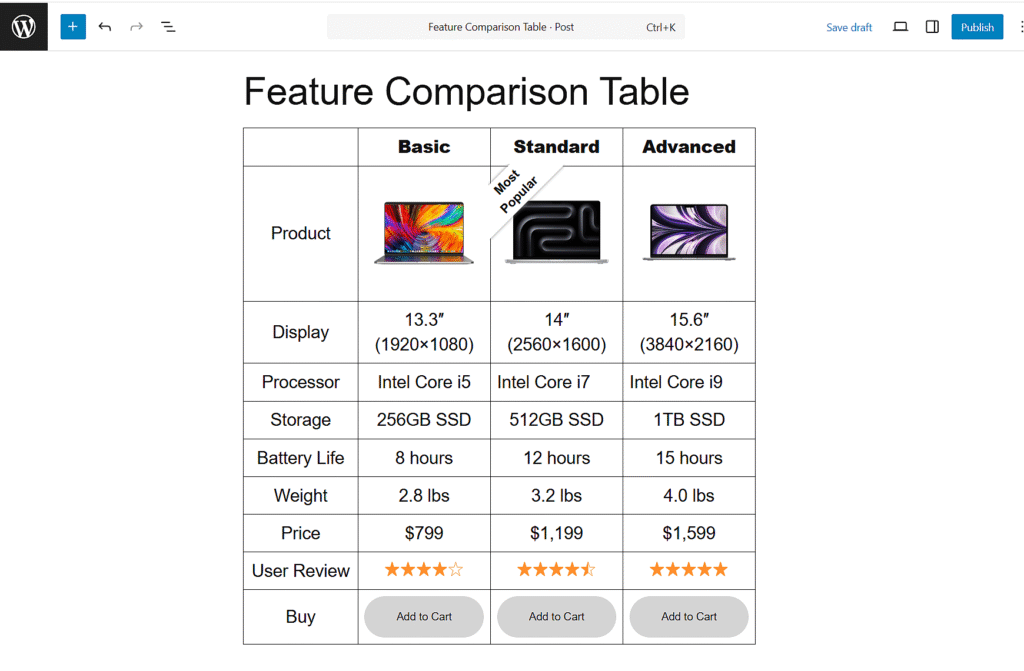
Step 5: Fill Each Cell with Feature Values or Content
Click into each cell and add the content that applies to that feature and item. You can enter plain text or use the block inserter (+) icon inside a cell to insert blocks like icons, buttons, images, lists, star ratings, ribbons, and more. This flexibility lets you show availability, quality, or actions directly inside the table.
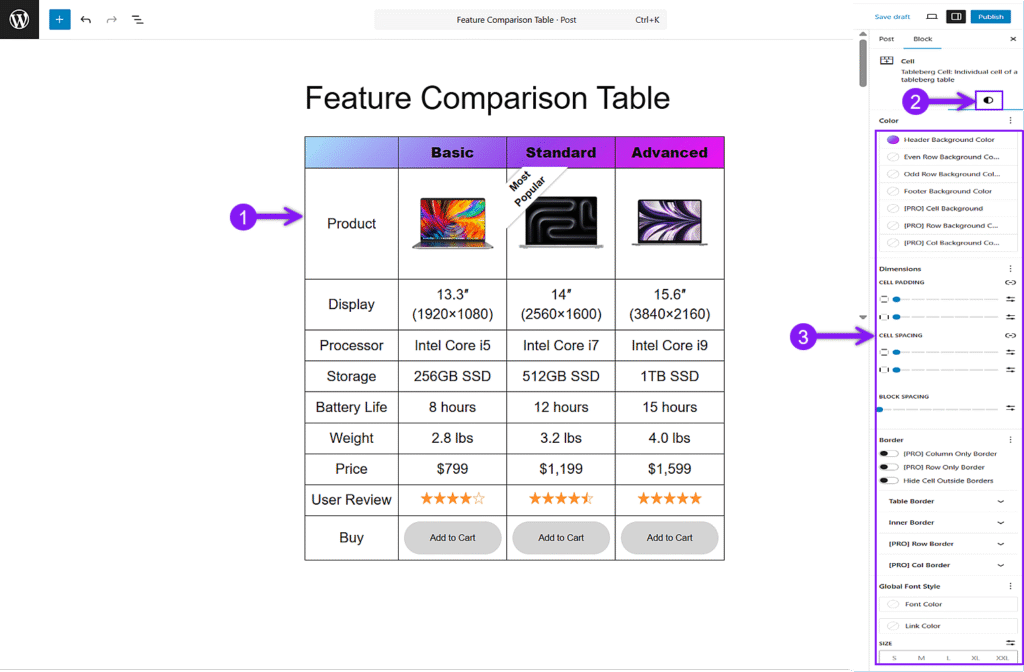
Step 6: Customize Table Styles
Select any cell of the table to open the sidebar settings. Under the “Style” tab, you can change header and footer background colors, adjust cell padding, and apply alternating row colors. These options help highlight key differences across plans or products. You can also set even and odd rows to different shades for easier reading.
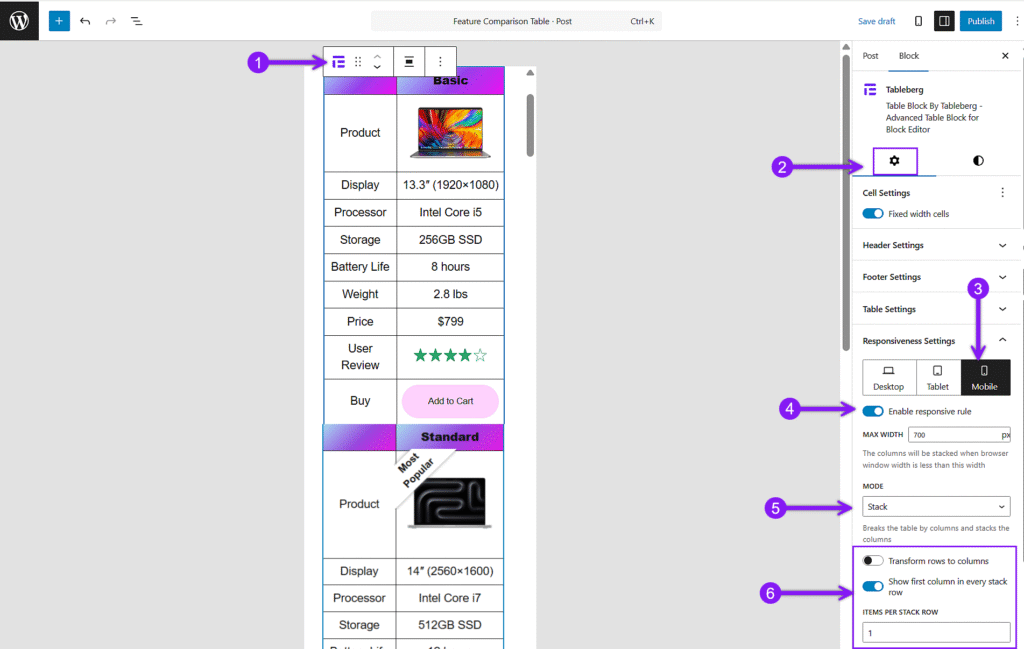
Step 7: Make the Table Responsive
Most visitors will view your table on a phone or tablet, so it needs to stay readable across all screen sizes. Select the table, open the block settings sidebar, and go to the Responsive setting from the dropdown. From there, choose the device, enable breakpoint, then pick either scroll or stack mode. Adjust the other settings as needed to keep the layout clear and usable.
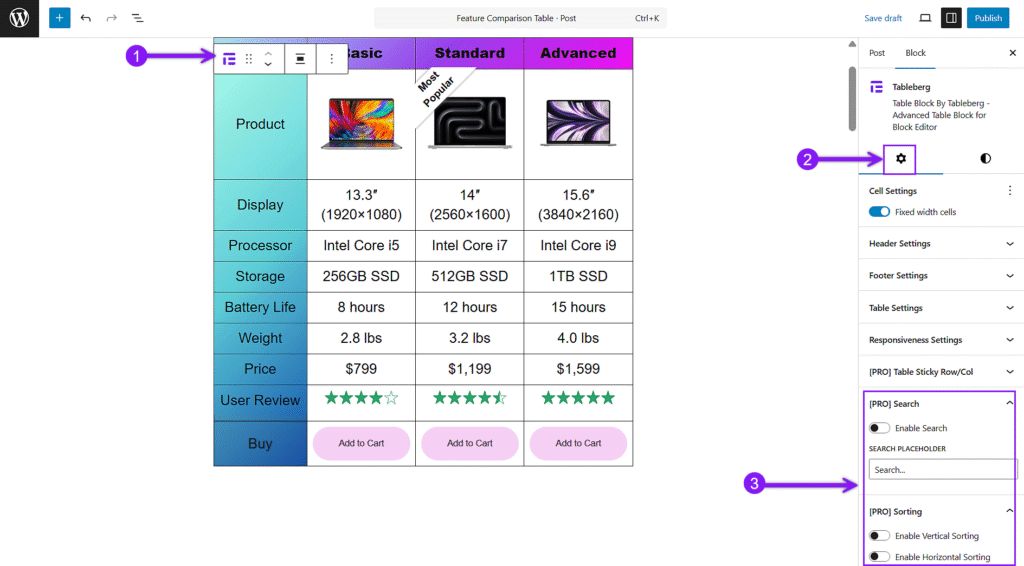
Step 8: Enable Sorting and Search Options
If your comparison table includes a long list of features, open the block toolbar and scroll down to access advanced options. From there, you can toggle on features like “Sorting” or “Search”, which are only available in the Pro version.
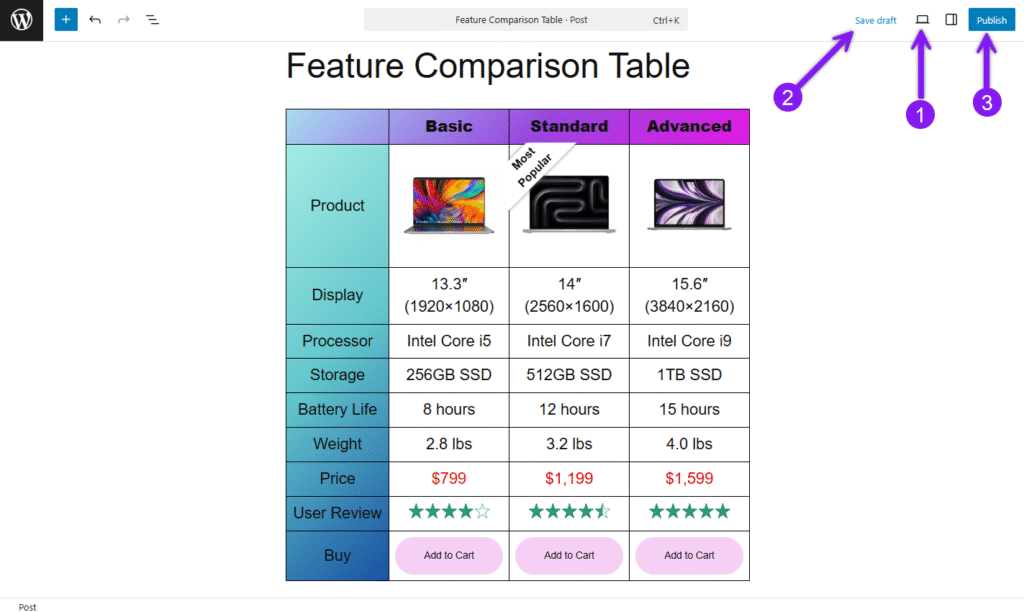
Step 9: Preview and Publish the Table
Use the Preview button to check how the table looks on both desktop and mobile. Once everything looks right, save your work and then click Publish or Update to make the table live on your site.
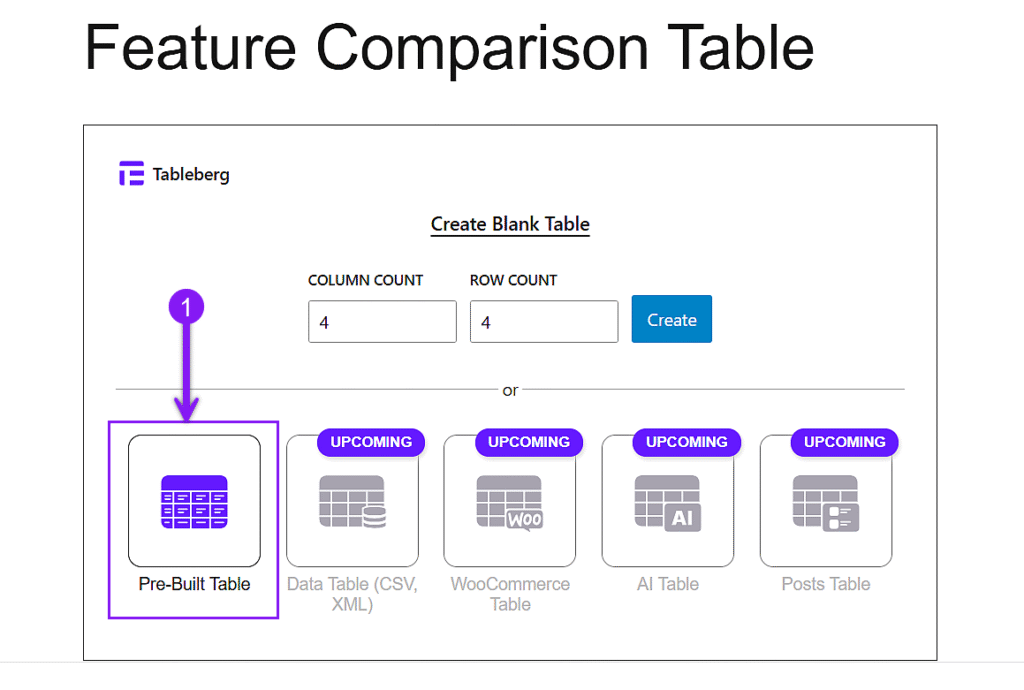
Skip the Setup with a Ready-Made Template
If you’d rather not build the table from scratch, Tableberg includes a set of pre-built table templates tailored for common use cases. After inserting the Tableberg block, select the Pre-Built Table option. This opens a library of over 25 templates, including layouts built specifically for feature comparisons, pricing tables, and product breakdowns. Choose the one that fits your needs, and it will be added directly to the editor. From there, you can replace the content, adjust the styling, and make it your own.
Final Thoughts
A good comparison table uses columns for options, rows for features, and visual elements like icons, ratings, and buttons to make differences clear. It should stay readable on any screen and guide decisions quickly.
This guide covered how to create the layout, add content, style it for clarity, enable responsiveness, use advanced features, and apply ready-made templates.
With the right structure and tools in place, your table is ready to help users compare and choose with confidence.
Also Read:

